Quick answer: across more than 30,000 people tested in Finland, the average vertical jump (CMJ, hands on hips) peaks at 35.3 cm in men aged 16 to 20 and 27.9 cm in women aged 21 to 25, then declines with age (about 0.9% per year between 52 and 58)[1]. Professional team sport players sit around 34 to 42 cm; sprinters on the Norwegian national team reach 62.7 cm (men) and 48.4 cm (women)[2].
Before comparing a number to an average, one rule: check the protocol. A vertical jump measured with an arm swing can be several centimeters higher than the same jump measured with hands on hips. And a force plate that calculates height from takeoff velocity doesn’t give the same number as a flight-time system. All the values below specify their method. The rating charts circulating online (“50 to 60 cm = average”) often mix protocols and aren’t sourced.
What is the average vertical jump by age and sex?
The largest database published to date includes 30,217 Finnish participants, tested on a countermovement jump (CMJ), hands on hips, on a contact mat[1]:
| Age | Men | Women |
|---|---|---|
| 6–10 years | 22.1 cm | 21.5 cm |
| 11–15 years | 27.3 cm | 24.5 cm |
| 16–20 years | 35.3 cm | 26.9 cm |
| 21–25 years | 34.6 cm | 27.9 cm |
| 26–30 years | 34.9 cm | 23.5 cm |
| 31–35 years | 32.4 cm | 22.8 cm |
| 36–40 years | 30.3 cm | 21.8 cm |
| 41–45 years | 28.6 cm | 19.5 cm |
| 46–50 years | 27.2 cm | 19.8 cm |
| 51–55 years | 26.2 cm | 18.7 cm |
| 56–60 years | 24.7 cm | 16.2 cm |
The adult groups in this study are smaller than the youth groups: treat values beyond age 25 as orders of magnitude. Beyond 60, the samples are too small to give a reliable average.
What is the average vertical jump for athletes?
| Sport and level | Average CMJ | Method |
|---|---|---|
| Sprint, national team (men) | 62.7 cm | Force plate[2] |
| Sprint, national team (women) | 48.4 cm | Force plate[2] |
| Volleyball, men’s elite (15 players, China) | 42 cm | Hands on hips[3] |
| Basketball, Spanish 1st division (Liga ACB) | 39.2 cm | Force plate, impulse[4] |
| Basketball, Spanish 4th division (Liga EBA) | 36.0 cm | Force plate, impulse[4] |
| Basketball, Spanish 4th division (another team) | 38.5 cm | Contact mat, flight time[5] |
| Soccer, 1st division (87 players, Poland) | 36 to 39 cm | Force plate[6] |
| Pro rugby league, backs | 36.4 cm | Force plate[7] |
| Pro rugby league, forwards | 34.1 cm | Force plate[7] |
| NCAA student-athletes (men / women) | 36 / 27 cm | Force plate[8] |
| Women’s handball U17–U19 | 28.7 cm | Force plate[9] |
Across 1,577 athletes from 44 sports in Norway, sprinters had the highest values, and men jumped on average 33% higher than women[2].
Two takeaways. First, the method matters as much as the level: in basketball, 4th-division players measured on a contact mat (38.5 cm) outscore those from the same division measured on a force plate (36.0 cm), and come close to Liga ACB professionals[4][5]. Second, vertical jump alone doesn’t determine level. Among 939 Norwegian soccer players, it was sprint times that separated the national team and 1st division from the lower divisions; for the CMJ, the authors mainly report a difference by position, with midfielders jumping about 2 cm lower than other players[10].
How does vertical jump change with age?
Vertical jump increases sharply during adolescence: between ages 11 and 15, it rises by about 5.6% per year in boys and 3.1% in girls. Statistical models place the peak at 18 in men and 17 in women. Men then maintain their level until 26–30, while women decline earlier. Between 52 and 58, the decline is about 0.9% per year[1]. But physical activity weighs much more than age: in people over 58, masters athletes jump on average 28.5 cm (men) and 22.7 cm (women), versus 15.1 cm and 8.2 cm in sedentary people of the same age[11]. In older adults, vertical jump is also a good indicator of leg power, which is linked to independence in daily life.

How do you measure your vertical jump to compare it with the average?
- Test: countermovement jump (CMJ), hands on hips, free-depth dip then maximal extension.
- Landing: legs straight, toes first. Bending the knees in the air skews the flight time.
- Trials: 3 jumps, 30 to 60 seconds of rest. Note the average and the best.
- Conditions: after a standard warm-up, never after a tiring session.
Variability from one jump to the next is on the order of 2.4 to 4.6%[12]: on 40 cm, a 1 cm difference between two sessions isn’t necessarily progress. To track fatigue or readiness, the average of the trials is more sensitive than the best trial[13].
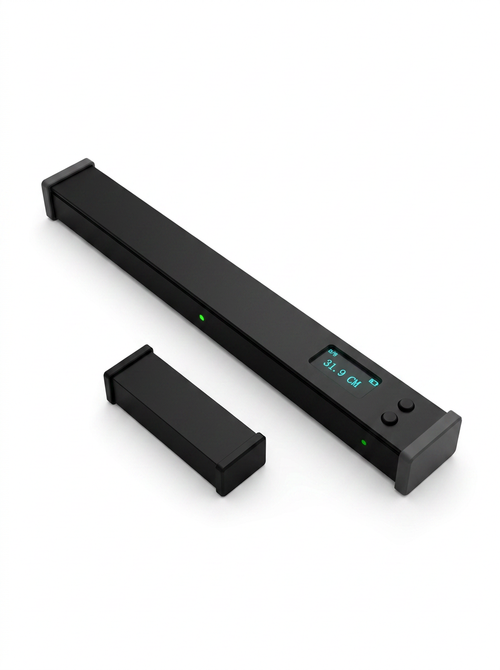
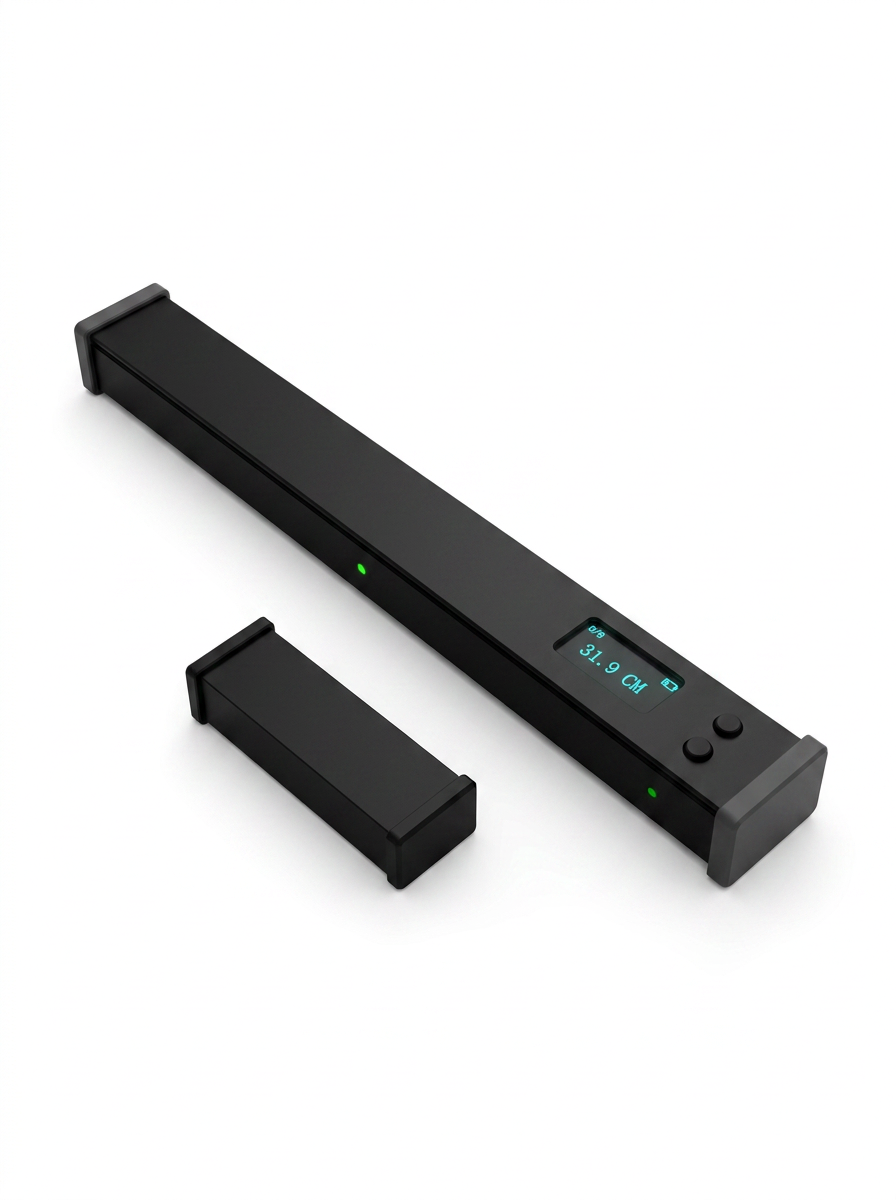
The Jump Gate measures flight time at 1,000 Hz between two infrared bars and instantly displays the height on its screen, with no calibration. The free app records each athlete’s history. To understand the flight time → centimeters conversion, read our article on calculating vertical jump height, and to improve, our guide how to measure and improve your vertical jump. To choose a device, see our Optojump and alternatives comparison.
What is a good vertical jump?
For a CMJ with hands on hips, based on this data:
| Benchmark | Men | Women |
|---|---|---|
| Untrained adult | 25 to 35 cm | 18 to 28 cm |
| Team sport athlete, good level | 35 to 42 cm | 27 to 32 cm |
| High-level sprinter or jumper | 55 cm and up | 45 cm and up |
These benchmarks are a synthesis of the studies cited, not official norms. The best benchmark remains your own history, measured with the same protocol.
How does your vertical jump compare with the average?
The Finnish database also gives the standard deviation for each age group[1]. Assuming a near-normal distribution, you can derive position benchmarks from it. This is our own approximation, not a published rating scale:
| Approximate position | Men 16–20 (35.3 ± 4.7 cm) | Women 16–20 (26.9 ± 4.0 cm) |
|---|---|---|
| About 16% score lower | 30.6 cm | 22.9 cm |
| Average | 35.3 cm | 26.9 cm |
| About 84% score lower | 40.0 cm | 30.9 cm |
| About 98% score lower | 44.7 cm | 34.9 cm |
These groups include 1,764 men and 402 women, which makes the benchmarks fairly stable. A young man who jumps 45 cm on a CMJ with hands on hips is therefore in the top 2% of his age group, above the average of the professional basketball and soccer players cited above. To track several athletes and compare their results with these benchmarks, the Explosiveness Pack combines the Jump Gate with reaction lights, from €548.99.
Frequently asked questions
What is the average vertical jump for a man?
About 35 cm between ages 16 and 30 on a CMJ with hands on hips, then about 30 cm around 40 and 26 cm around 50, according to a database of 30,217 participants[1].
What is the average vertical jump for a woman?
About 27 to 28 cm between ages 16 and 25, then about 22 cm around 35–40 and 19 cm around 50, in the same database[1].
Why is my vertical jump higher with an arm swing?
The arm swing adds velocity at takeoff. That’s why reference tests are done with hands on hips: the result depends only on the legs.
What was the vertical jump of NBA players?
The “record” vertical jumps cited for NBA players are measured with an approach and arm swing, often with a vertical jump measuring device using vanes. They aren’t comparable to a CMJ with hands on hips.
Sources (accessed October 10, 2026)
- Koivunen et al. (2026), Scandinavian Journal of Medicine & Science in Sports
- Haugen et al. (2021), International Journal of Sports Physiology and Performance
- Frontiers in Physiology (2024), elite volleyball players
- Suárez-Balsera et al. (2025), Journal of Human Kinetics
- Biel-Costa et al. (2024), International Journal of Exercise Science
- Journal of Clinical Medicine (2024), Polish 1st division soccer players
- McMahon et al. (2022), Sensors
- Sole, Suchomel & Stone (2018), Sports
- European Journal of Applied Physiology (2024), women’s handball
- Haugen et al. (2013), International Journal of Sports Physiology and Performance
- Frontiers in Aging (2024), masters athletes and sedentary adults
- Markovic et al. (2004), Journal of Strength and Conditioning Research
- Claudino et al. (2017), Journal of Science and Medicine in Sport