The reactive strength index, better known as RSI, answers a question that jump height alone cannot settle: does your athlete jump high because they take their time on the ground, or because they rebound fast? Two players who jump 35 cm in a drop jump can have contact times of 180 ms and 300 ms. For a sprinter, a basketball player or a soccer player, that difference matters. RSI combines both pieces of information into a single number. It is used to dose plyometrics, spot fatigue and track a return to play. In this article, you will find its definition, the step-by-step calculation, the difference with RSImod measured on a force plate, benchmark values from published studies, and how to use it in practice in training.
In short: RSI is calculated by dividing jump height (in meters) by ground contact time (in seconds) during a drop jump or repeated rebounds. Elite hurlers score about 1.6 to 1.7 from 30 cm, professional basketball players about 2.1. A change smaller than roughly 0.1 cannot be interpreted: always compare the same drop height, with the same device.
What is the reactive strength index (RSI)?
RSI describes the ability to switch very quickly from a braking phase to a pushing phase: it is the measurable expression of the fast stretch-shortening cycle. It is traditionally measured with the drop jump: the athlete steps off a box, touches the ground and rebounds immediately, as high and as fast as possible. Measured this way, it is highly reproducible from one session to the next[3].
Two conventions coexist, and they do not give the same numbers:
- height ÷ contact time, expressed in m/s. This is the most common in recent studies[1][2];
- flight time ÷ contact time, unitless.
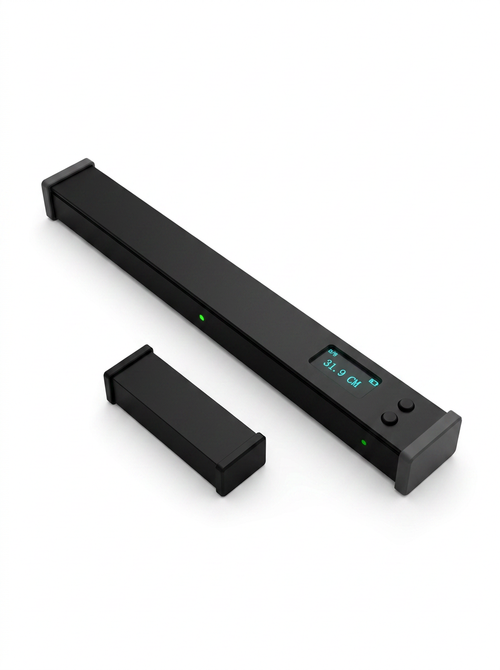
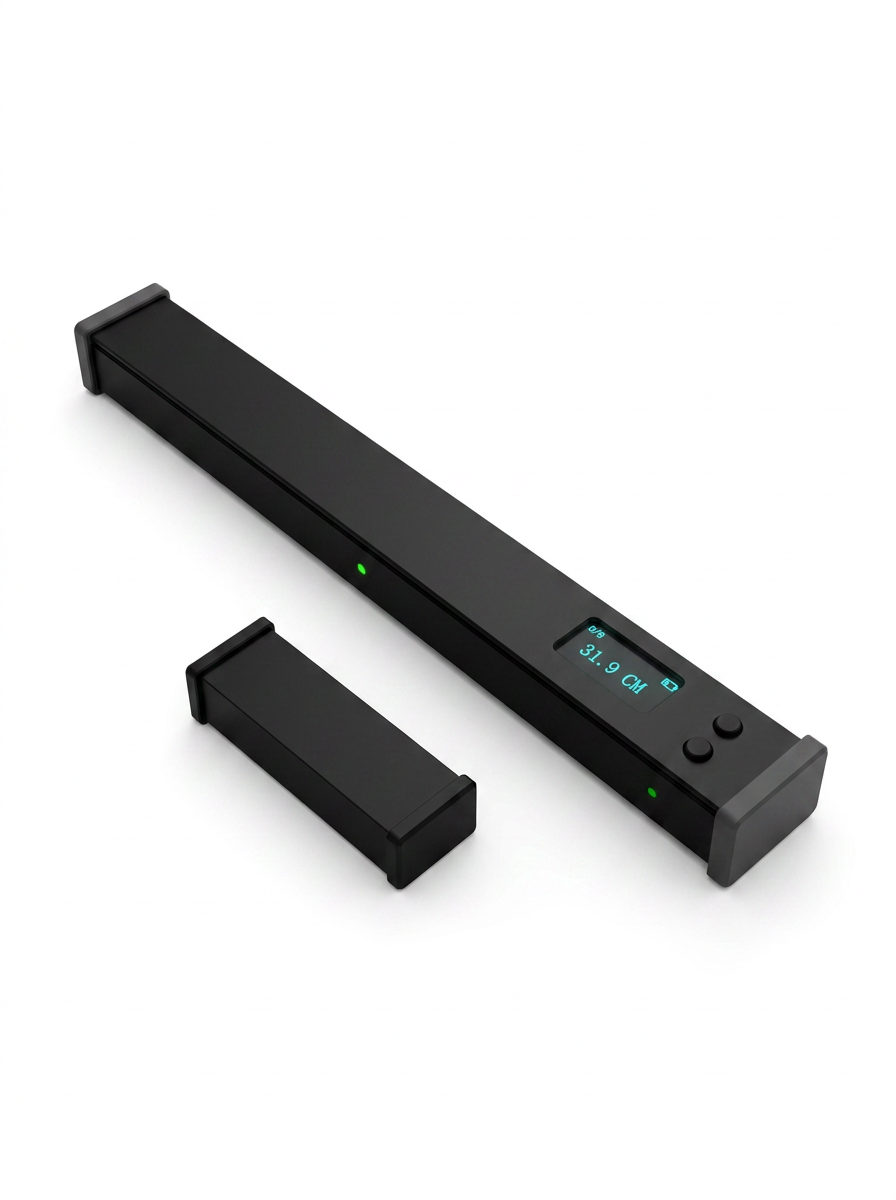
For a flight of 0.500 s (about 31 cm) and a contact of 0.200 s, the first gives 1.53 and the second 2.5. Before comparing a number to a norm or to another device, check which formula is used. The Jump Gate calculates RSI as height divided by contact time.
How do you calculate drop jump RSI?
You need two measurements: the ground contact time between landing and rebound, and the rebound height, calculated from flight time. The details of this conversion are in our article on calculating jump height from flight time.
| Rebound height | Ground contact time | RSI (m/s) |
|---|---|---|
| 0.25 m | 0.250 s | 1.0 |
| 0.28 m | 0.175 s | 1.6 |
| 0.35 m | 0.175 s | 2.0 |
| 0.40 m | 0.160 s | 2.5 |
The table shows the two levers: jumping higher with the same contact time, or keeping the same height while spending less time on the ground. A contact of 250 ms or less is generally considered a fast stretch-shortening cycle[1][2].
RSI on repeated rebounds
The 10/5 test consists of 10 maximal rebounds in place, keeping contacts short, and keeping the best 5. A force plate study shows that the first rebounds are weaker: the best RSI values most often appear between the 7th and 10th jump[4]. This test avoids the box and works well for groups.
RSI vs RSImod: what is the difference?
The modified RSI (RSImod) was proposed in 2010 to assess jumps without a prior contact phase, such as the CMJ[5]. You divide CMJ height by the time needed to take off, measured from the start of the countermovement. That start of movement can only be seen on a force plate or an equivalent sensor: a flight-time system (bars, mats) measures drop jump or rebound RSI, not RSImod.
In 151 NCAA Division I athletes, mean RSImod was 0.42 m/s in men and 0.31 m/s in women[6]:
| Percentile (RSImod, CMJ) | Men | Women |
|---|---|---|
| 90th | 0.547 m/s | 0.434 m/s |
| 75th | 0.492 m/s | 0.379 m/s |
| 50th | 0.419 m/s | 0.308 m/s |
| 25th | 0.352 m/s | 0.248 m/s |
| 10th | 0.308 m/s | 0.202 m/s |
These values cannot be compared to drop jump RSI: the CMJ lasts much longer than a rebound, hence numbers about four times lower.
What RSI values should you aim for in the drop jump?
There is no universal norm: RSI depends on drop height, formula and device. Here are published benchmarks, to be used as orders of magnitude:
| Population | Test | Mean RSI |
|---|---|---|
| Elite hurlers (23 men) | Drop jump 30 cm | 1.64 to 1.69 m/s[2] |
| Elite hurlers (20 men) | 10/5 test | 1.56 to 1.60 m/s[2] |
| Professional basketball players (13 men) | Drop jump 20 to 50 cm | about 2.1[2][7] |
The most useful question is often: how big must a difference be for a change to be real? In the hurling study, the typical error was 0.09 for the drop jump and 0.08 for the 10/5 test, and the smallest “moderate” change was 0.14 and 0.11[2]. In practice, an RSI change smaller than roughly 0.1 between two sessions should be confirmed before being interpreted. To benchmark your athletes' height, also see our average vertical jump values.
Using RSI in plyometrics and return to play
Choosing the drop height
A common practice is to test the drop jump from several heights (for example 20, 30, 40 cm) and keep the one that gives the best RSI. Beyond that, the athlete “sinks”: contact time increases faster than height rises. In professional basketball players, RSI was highly reproducible at 20, 40 and 50 cm[7].
Steering the session
Measured on every rep, RSI tells you when quality drops. A set that starts at 2.0 and ends at 1.6 is no longer training the same quality. Our guide to measuring and improving your vertical jump offers a stop threshold and an 8-week program. Drop jump RSI is also part of the Bosco test battery.
Tracking a return to play
After anterior cruciate ligament reconstruction, athletes cleared to return recovered 97% symmetry on horizontal hop distance, but only 83% on single-leg vertical jump height and 77% on single-leg drop jump height[8]. Vertical jump tests therefore reveal deficits that horizontal tests hide; RSI measured leg by leg can complement this monitoring. Interpreting them and giving the green light belong to the physical therapist or physician.

Also in our vertical jump series
Conclusion
RSI sums up in one number the ability to jump high while spending little time on the ground. Always calculate it the same way (height ÷ contact time), from the same drop height, with the same device, and consider that a difference smaller than roughly 0.1 needs confirmation. It helps you choose the drop height, stop a set at the right time and objectively assess a return, together with the physical therapist. The Jump Gate measures height, ground contact time and RSI on every rebound; combined with reaction lights in the Explosiveness Pack (from €548.99), it lets you train ground reactivity and visual reaction. To compare other measurement tools, read our comparison Chronojump or Jump Gate.
Frequently asked questions
How do you calculate RSI?
Divide jump height, in meters, by ground contact time, in seconds. Example: a 0.35 m rebound after 0.175 s of contact gives an RSI of 2.0. Some devices divide flight time by contact time instead: the numbers are then not comparable.
What is a good drop jump RSI?
There is no single norm. Elite hurlers reach about 1.6 to 1.7 from 30 cm, professional basketball players about 2.1. The most useful approach is to track the same athlete over time, with the same protocol and the same device.
What box height should you use to measure RSI?
A height of 30 to 40 cm suits most trained athletes. You can also test several heights and keep the one that gives the best RSI. What matters is always using the same one to compare sessions.
What is the difference between RSI and RSImod?
RSI is measured on a rebound (drop jump, repeated jumps): height divided by contact time. RSImod is measured on a CMJ: height divided by the time needed to take off. It requires a force plate and gives much lower values.
Sources (accessed October 20, 2026)
- Flanagan and Comyns (2008), Strength and Conditioning Journal
- Clancy, Collins and Comyns (2026), Sports, RSI in the drop jump and 10/5 test
- Flanagan, Ebben and Jensen (2008), Journal of Strength and Conditioning Research
- Stratford, Dos'Santos and McMahon (2020), Biomechanics, 10/5 test
- Ebben and Petushek (2010), Journal of Strength and Conditioning Research, RSImod
- Sole, Suchomel and Stone (2018), Sports, RSImod reference values
- Markwick et al. (2015), International Journal of Sports Physiology and Performance
- Kotsifaki et al. (2022), British Journal of Sports Medicine